Job Orchestration System: Data Transformation Tasks
HydroServer's Job Orchestration System allows you to define automated tasks that handle data aggregations (e.g., computing daily data from subdaily data) and data transformations (e.g., applying a rating curve or mathematical expression to data values).
1. Create a Data Aggregation Task
Aggregation tasks are used to summarize high-frequency data into lower-frequency data. For example, an aggregation task can convert hourly or subdaily discharge data into daily average discharge values. This is useful when users want to reduce detailed time-series data into a simpler summary datastream for reporting, analysis, or visualization.
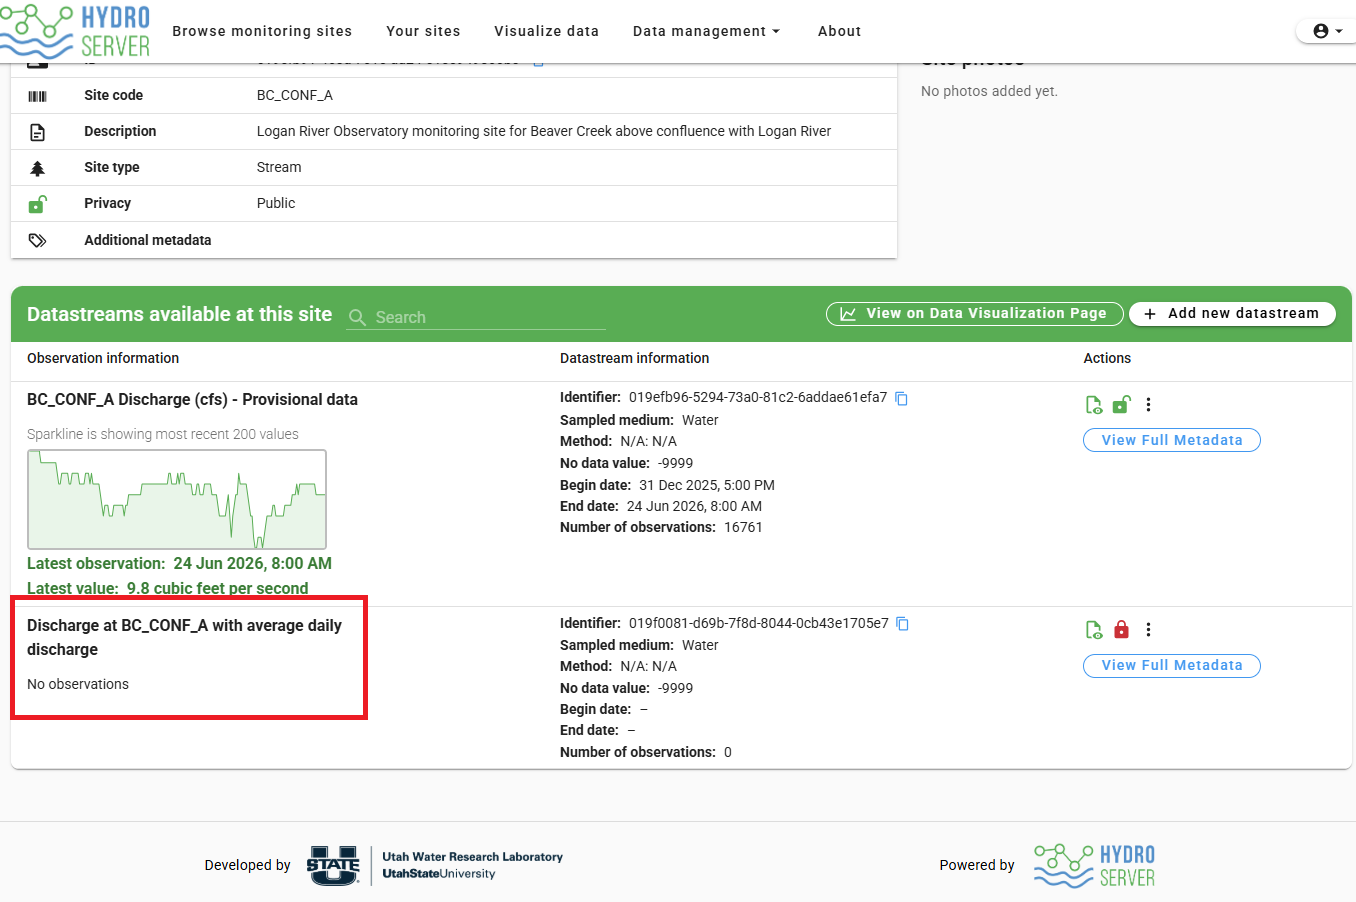
Before creating an aggregation task, make sure that metadata for the output datastream already exists. The aggregation task needs a place to save the processed results. For example, if the goal is to convert 15-minute discharge data into daily average discharge data, create a new datastream first for the daily average discharge output.
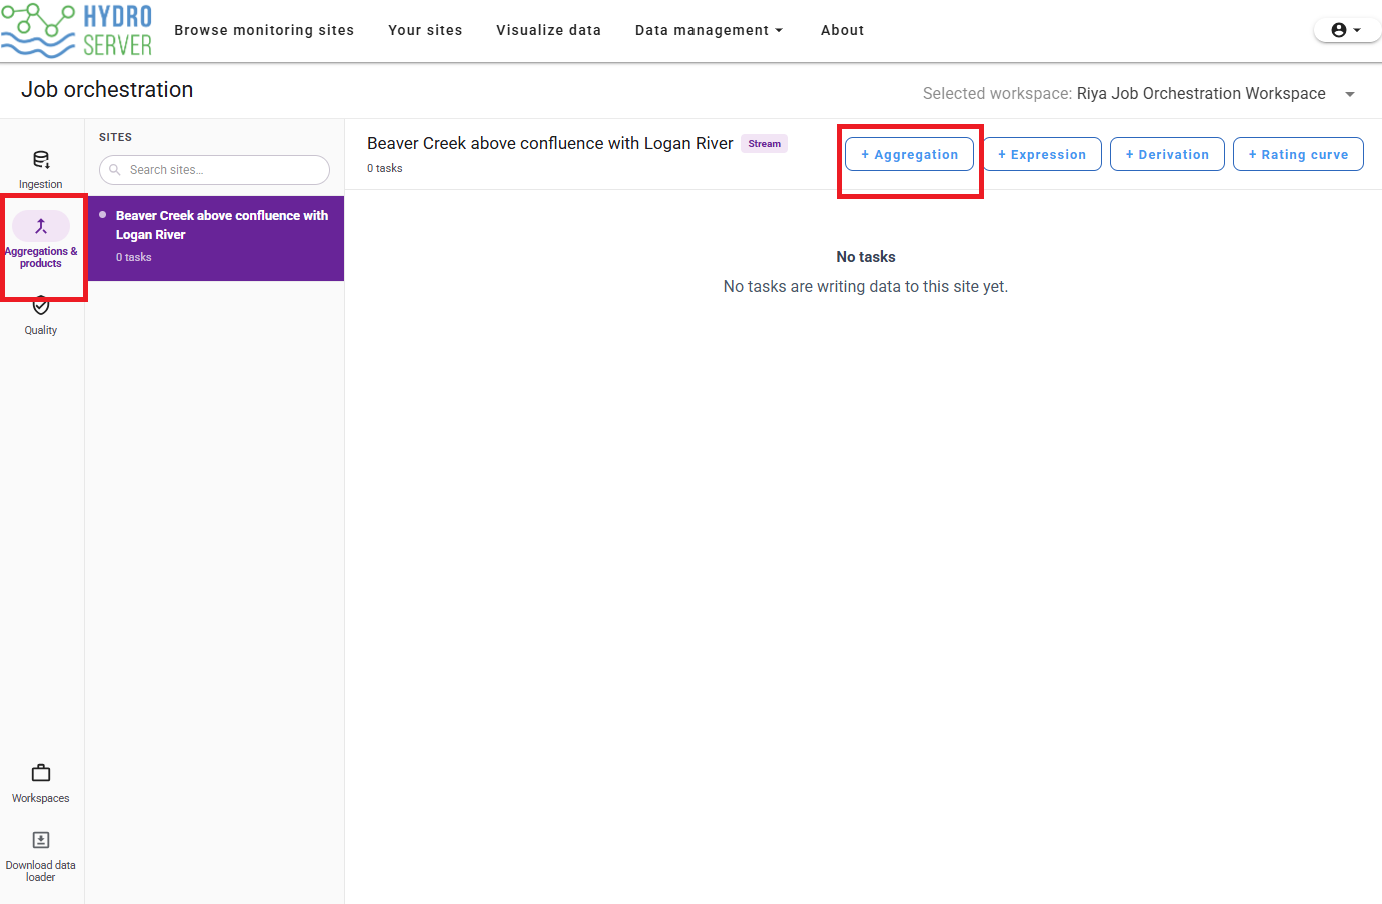
After the output datastream is ready, go to the Job Orchestration page and select Aggregations & products from the left navigation rail.
Data aggregations and transformation products are organized by monitoring site. First select the site where you want to create new, aggregated data and then click the +Aggregation button to create a new aggregation task.
NOTE: Make sure you have selected the correct Workspace at the top of the Job Orchestration System window to ensure that the correct list of monitoring sites is shown.
Aggregation tasks are used to summarize higher-frequency data into lower-frequency data. In this example, the input datastream contains discharge observations recorded every 15 minutes, and the task calculates one daily average discharge value for each day. The input datastream name is BC_CONF_A Discharge (cfs) - Provisional data, and the output datastream name is Discharge at BC_CONF_A with average daily discharge.
In the task form, enter a clear task name, such as BC_CONF_A Discharge (15 mins to daily average). Then choose whether the task should run manually or on a schedule. In this example, the task is scheduled to run every 1 Hour. The schedule controls how often HydroServer checks and runs the task, but it does not control the output time interval used by the aggregated data.
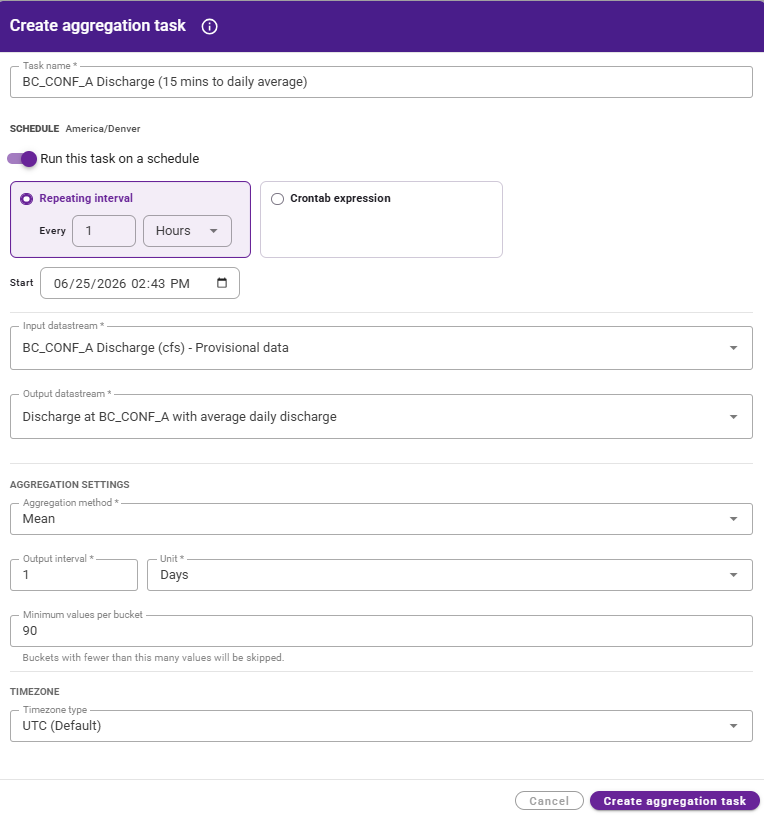
Next, select the input and output datastreams. The input datastream is the original 15-minute discharge datastream, and the output datastream is the new daily average discharge datastream. Under Aggregation Settings, set the aggregation method to Arithmetic Mean. This tells HydroServer to calculate a mean value for the available discharge values within each daily time bucket. The dropdown also includes Time Weighted Mean, Sum, Min, Max, First, and Last. Choose the method that produces the daily values you need.
Here, the output interval is set to 1 Day, so HydroServer writes one aggregated value per day. In this example, the minimum values per bucket is set to 90, which allows a small number of missing 15-minute values but prevents HydroServer from creating a daily average when too many data are missing. Where missing values are expected, Time Weighted Mean may be a better choice. The timezone is set to UTC (Default), so the daily buckets use UTC day boundaries. Choose this setting carefully so aggregation intervals start and end at the intended time (for example, midnight-to-midnight in UTC or Mountain Standard Time).
After the settings are complete, click Create aggregation task. The task will appear in the Aggregations & products task list. To test the task immediately, click Run now.
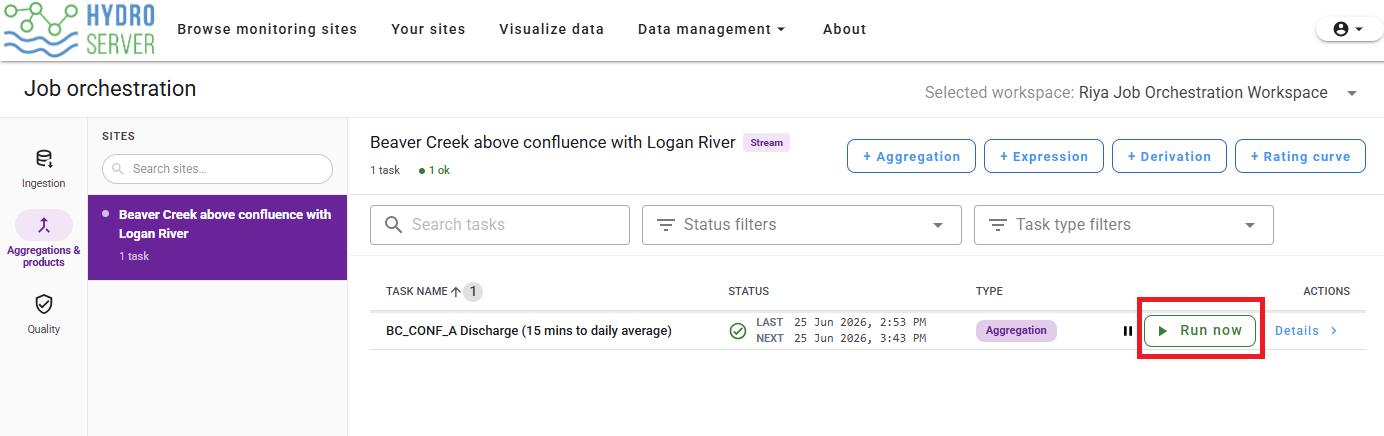
After the aggregation task runs successfully, return to the site details page and check the output datastream. The new, aggregated datastream should contain the aggregated daily average values created by the task.
2. Create a Derivation Task
Derivation tasks are used to create a new datastream by applying a mathematical formula or expression to values from one or more input datastreams. This is useful when the original data are already stored in HydroServer, but the values need to be converted, adjusted, or recalculated before being used for analysis or reporting. For example, a derivation task can be used to convert discharge values from cubic feet per second (cfs) to cubic meters per second (cms).
For derivation tasks, the output datastream uses the same time spacing as the input datastreams, so all input datastreams must share the same time spacing. Derivations are appropriate for simple transformations such as unit conversions or for more complex calculations involving multiple input datastreams. For example, a derivation task can calculate the difference between two temperature datastreams, combine measurements from multiple sensors, or calculate a basin sum from several streamflow datastreams.
Before creating a derivation task, make sure the output datastream already exists in the workspace. The derivation task needs a target datastream where HydroServer can save the calculated results. In this example, the input datastream contains daily average discharge values in cfs, and the output datastream is created to store the converted daily discharge values in cms.
To create a derivation task, go to the Job Orchestration page and select Aggregations & products from the left menu. Then click the +Derivation button. The derivation task form will open.
In the "Create derivation task" form, enter a clear task name that describes what the derivation will do. In this example, the task is named Discharge data from cfs to cms because the task converts discharge values from cubic feet per second to cubic meters per second.
Next, configure the task schedule. In this example, the task is scheduled to run every 1 Day. The schedule controls how often HydroServer checks for new input data and runs the task. It does not change the time interval of the data itself.
Select the output datastream and then specify one or more input datastreams. HydroServer will read values from the input datastreams, and the output datastream is where HydroServer will write the calculated values.
In this example:
Output datastream: Discharge at BC_CONF_A with daily discharge in cms
Input datastream 1: Discharge at BC_CONF_A with average daily discharge
In the "Formula" section, HydroServer represents each input value as the variable (e.g., a for Input datastream 1). Since 1 cfs = 0.0283168 cms, the formula is written as:
a * 0.0283168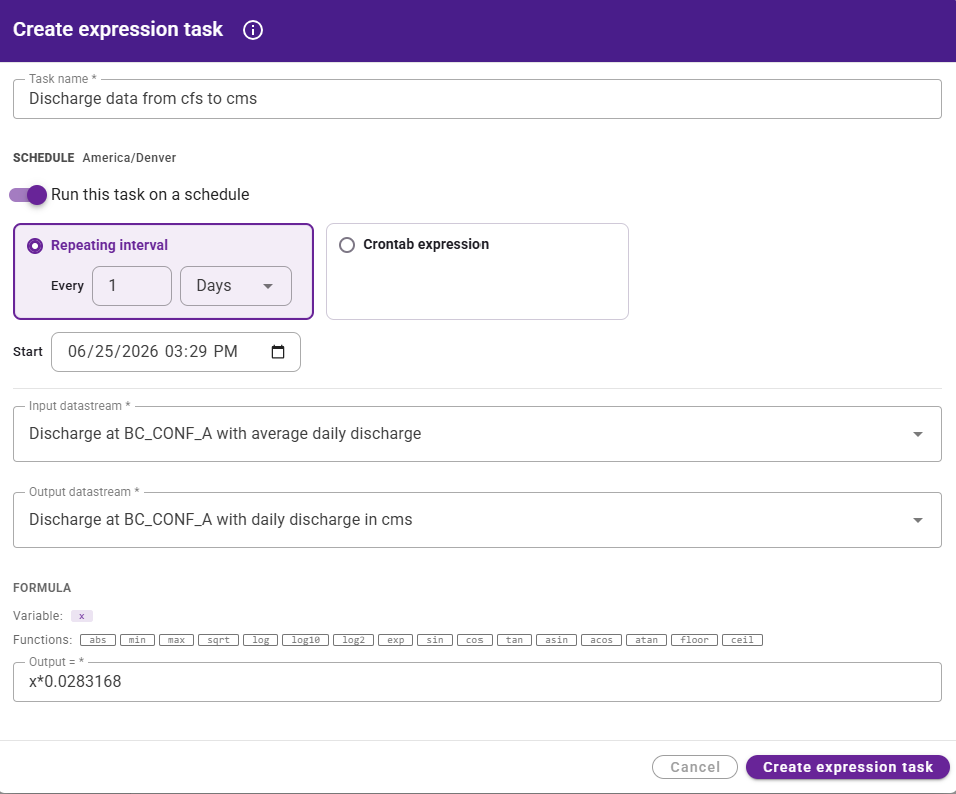
Derivations with More than One Input Datastream
Derivation tasks can also be used when a calculated output depends on multiple input datastreams. Each input datastream is assigned a variable name, such as a, b, or c, and those variables are used together in a formula to calculate an output datastream.
Input datastreams must have the same time spacing for a derivation to compute successfully. Before creating a derivation task, make sure the output datastream already exists in the workspace. The derivation task needs a target datastream where HydroServer can save the calculated results.
To create a derivation task, go to the Job Orchestration page and select Aggregations & products from the left menu. Then click Derivation. The derivation task form will open.
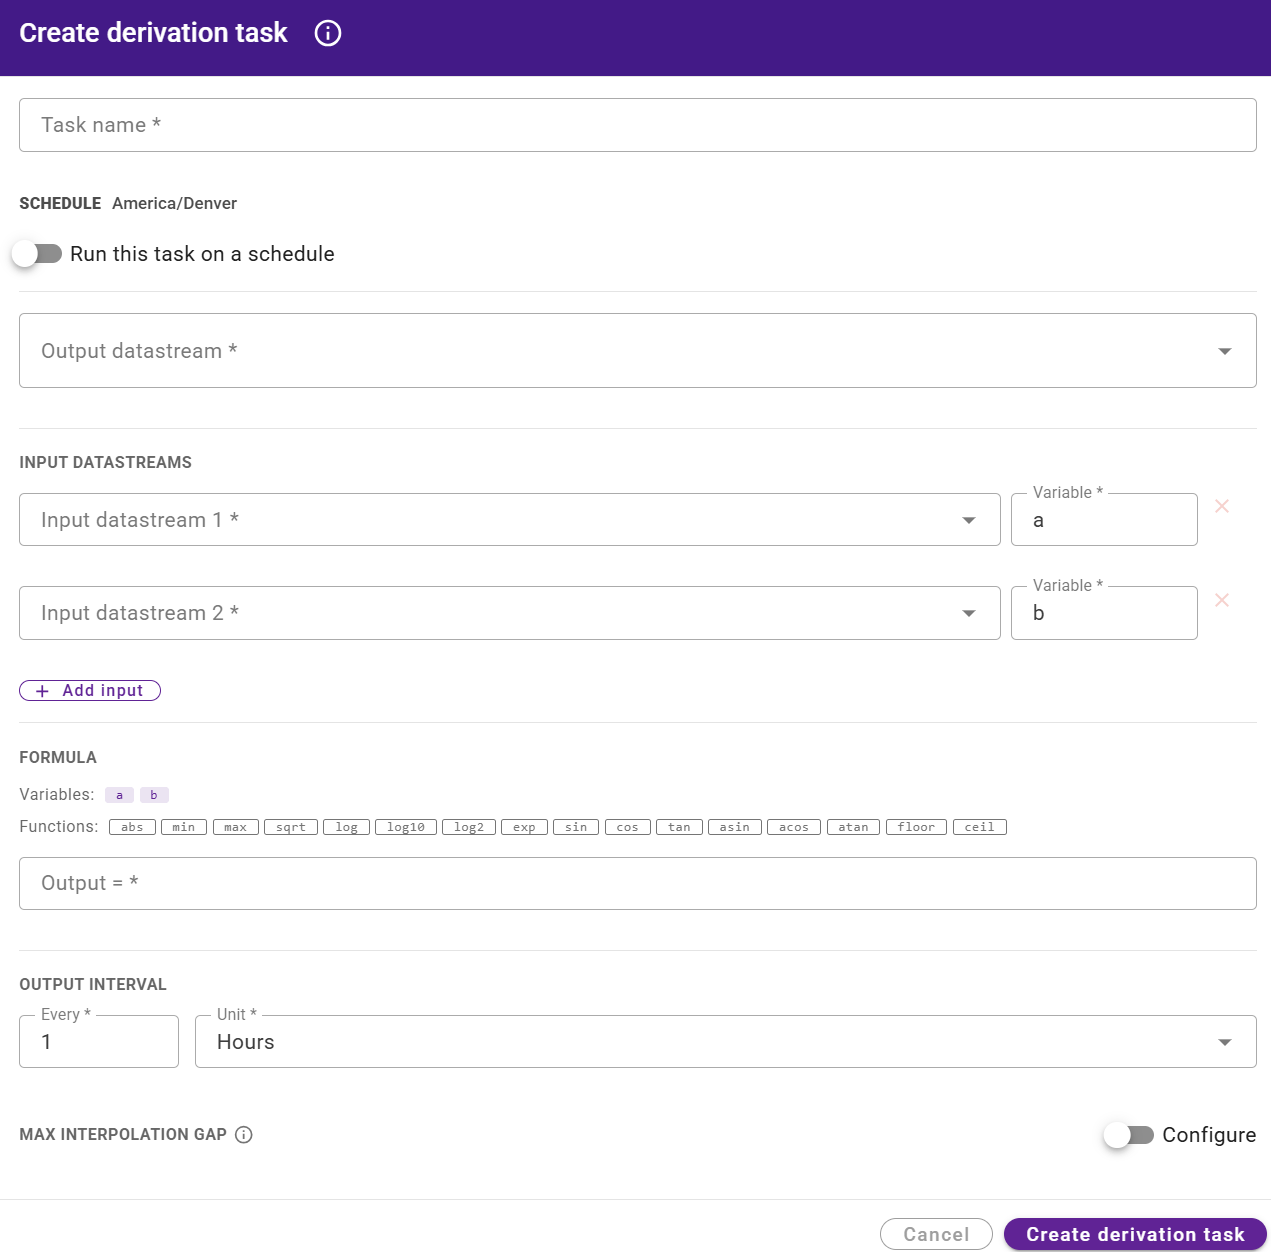
In the task form, enter a clear task name that describes what the derivation will calculate. Then choose whether the task should run manually or on a schedule. The schedule controls how often HydroServer checks for new input data and runs the derivation. Next, select the output datastream. This is the datastream where HydroServer will write the calculated results.
Then select the input datastreams that will be used in the formula. Each input datastream must be assigned a variable name. For example, the first input datastream can be assigned the variable a, and the second input datastream can be assigned the variable b. Additional input datastreams can be added by clicking Add input. This allows the formula to use more than two variables if needed.
In the formula section, use the assigned variables to define the expression for the calculation. For example, if the goal is to calculate the difference between two input datastreams, the formula could be written as:
a - bIn this example:
a = first input datastream
b = second input datastream
a - b = output value derived using the expression
3. Deriving New Values Using a Rating Curve
A rating curve task is used to transform an input datastream into an output datastream according to a rating curve that specifies a set relationship between the input variable and the output variable. For example, a rating curve can be used to calculate discharge from water level, stage, or gage-height data or reservoir storage volume from reservoir level data. At many monitoring sites, a sensor may measure water level directly, but users may also need to derive discharge values for analysis, visualization, or reporting. A rating curve provides the relationship between water level and discharge, and HydroServer uses this relationship to estimate discharge from the input water-level datastream.
The general workflow is:
stage or gage height → rating curve → dischargeBefore creating a rating curve task, make sure the required datastreams already exist in the workspace. The input datastream should contain the water level, stage, or gage-height values - or, in general the input values from which the output values will be derived using the rating curve. The output datastream should be the datastream where HydroServer will save the calculated values. To create a rating curve task, go to the Job Orchestration page and select Aggregations & products from the left menu. Then click Rating curve. This will open the rating curve task form.
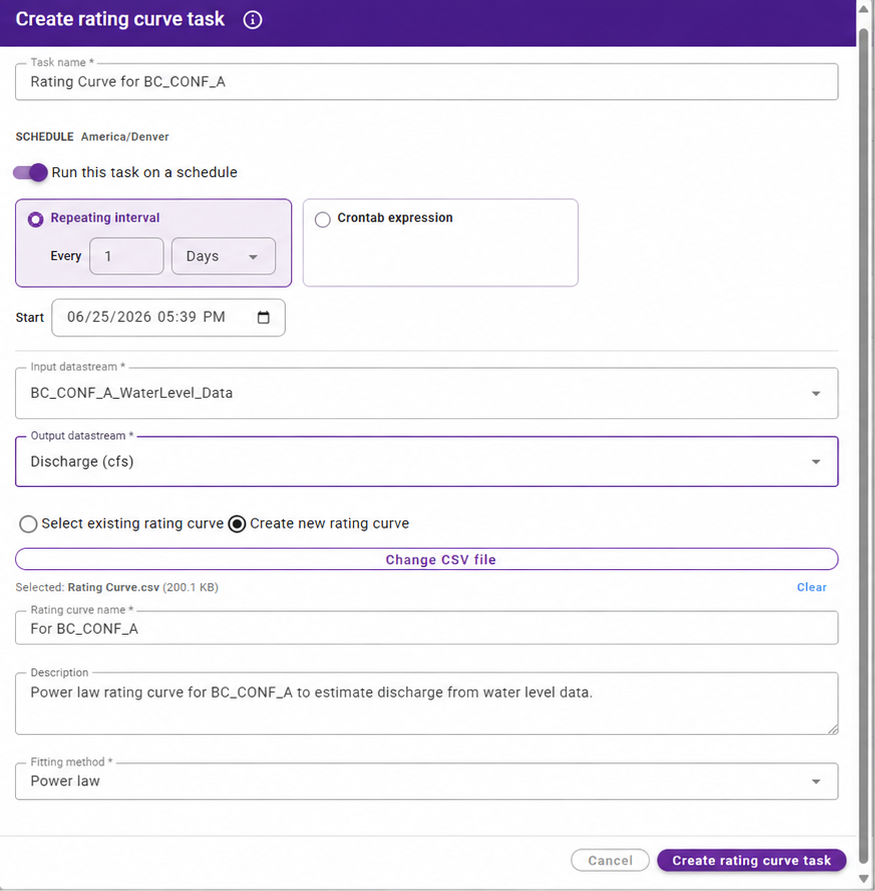
In the rating curve task form, first enter a clear task name. The task name should describe what the rating curve task will calculate. In this example, the task is named Rating Curve for BC_CONF_A.
Next, configure the schedule. The task can be run manually or on a schedule. The schedule controls how often HydroServer checks the input datastream and applies the rating curve. For testing, it may be helpful to run the task manually first and then enable the schedule after confirming that the task works correctly.
After setting the schedule, select the input datastream. The input datastream should be the datastream that contains the water level, stage, or gage-height values. In this example, the input datastream is BC_CONF_A_WaterLevel_Data. Then select the output datastream. The output datastream is where HydroServer will save the calculated discharge values from the rating curve. The output datastream should already be created before setting up the rating curve task. In this example, the output datastream is named Rating Curve.
The next step is to select or create the rating curve. If a rating curve already exists in HydroServer for the monitoring site, you can choose Select existing rating curve and select the rating curve that should be used. If a rating curve has not been created yet, choose Create new rating curve. When creating a new rating curve, a CSV file containing x-y pairs that define the rating curve must be uploaded. This CSV file provides the reference values HydroServer uses to build the rating curve. The CSV file should contain paired values, usually one column for the input variable (e.g., water level, stage, or gage height), and one column for the output variable (e.g., discharge).
For example, the CSV file may look like this:
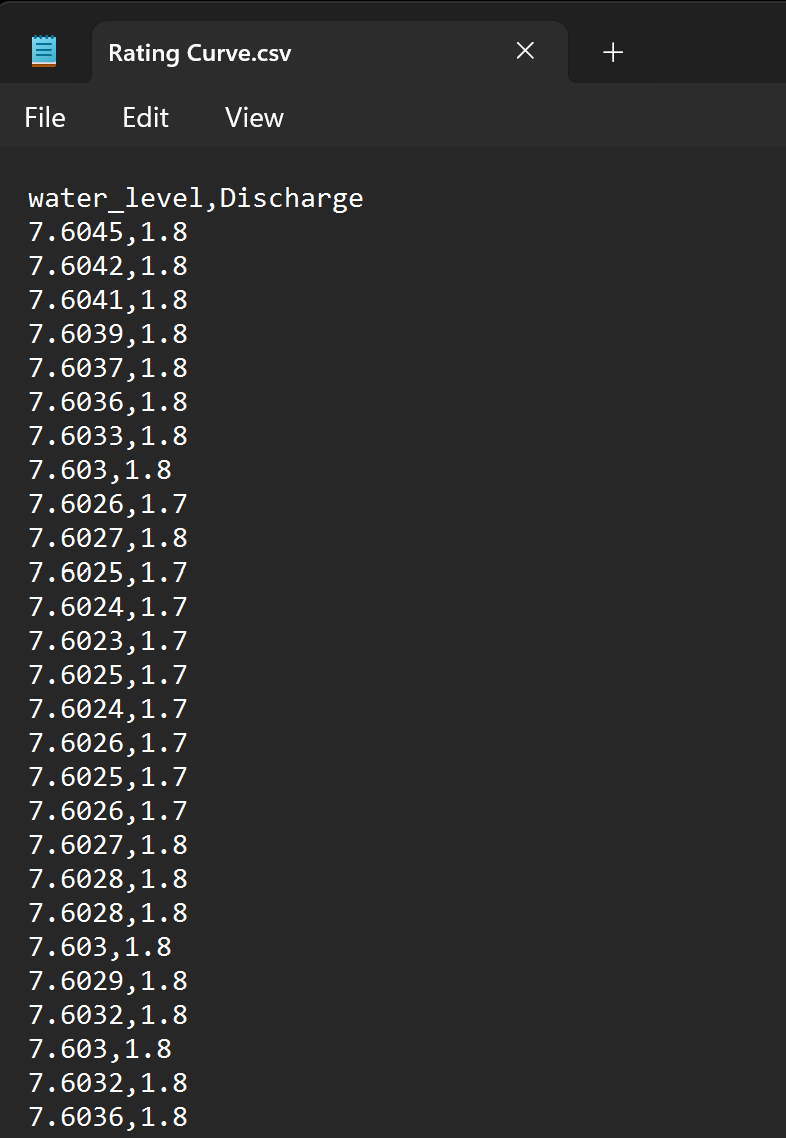
In this example, water_level is the input value and Discharge is the output value. HydroServer uses these paired values as the reference relationship between water level and discharge. Based on the uploaded CSV file and the selected fitting method, HydroServer applies the rating curve to the data values in the input datastream to create the values in the output datastream.
When preparing the rating curve CSV file, make sure the input values are unique. For example, the same water_level value should not be repeated in the input column. If duplicate input values are included, HydroServer may show an error such as Duplicate input_value in points.
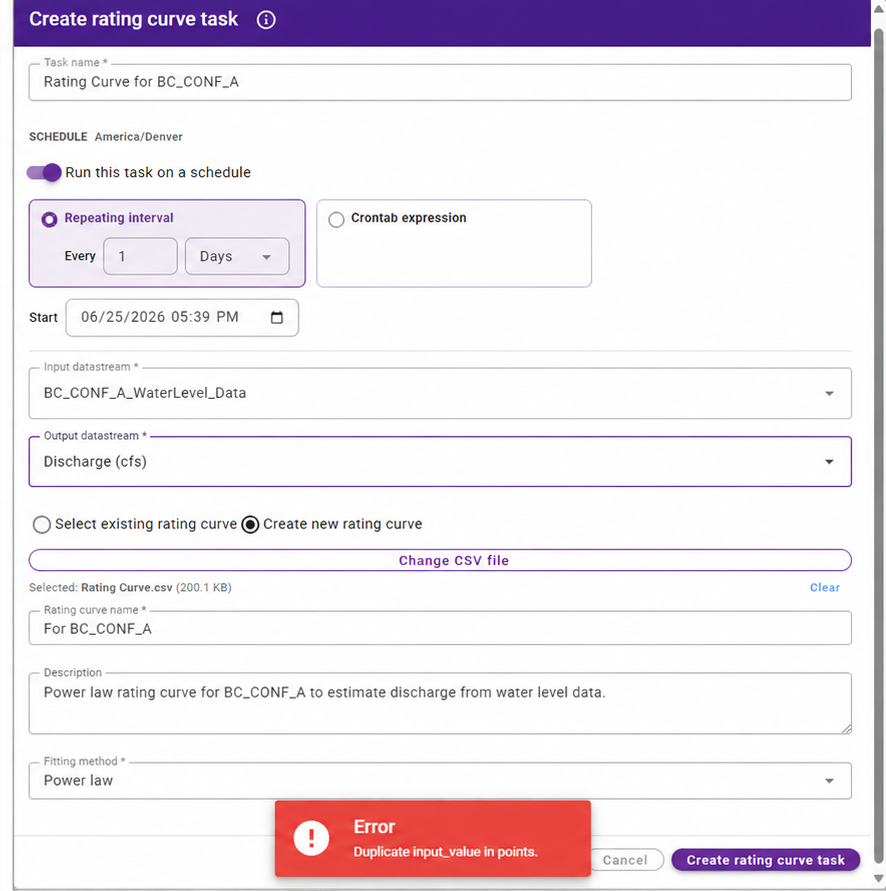
If this error appears, edit the CSV file and remove duplicate values from the input column before uploading it again. One way to do this is to open the CSV file in Excel, select the water-level or stage column, and use Data → Remove Duplicates. Make sure only the input column is selected when removing duplicates. Then save the file again as a CSV and upload it again.
After uploading the CSV file, enter a rating curve name and description. The rating curve name should clearly describe the site or purpose of the curve. The description can explain what the curve is used for, such as estimating discharge from water-level data. Next, select the fitting method. HydroServer provides multiple fitting method options, that are used when estimating output values for input values that have to be interpolated between input value points. You should choose the method that best fits the relationship in the data contained within the CSV file. In this example, the fitting method is set to Power law.
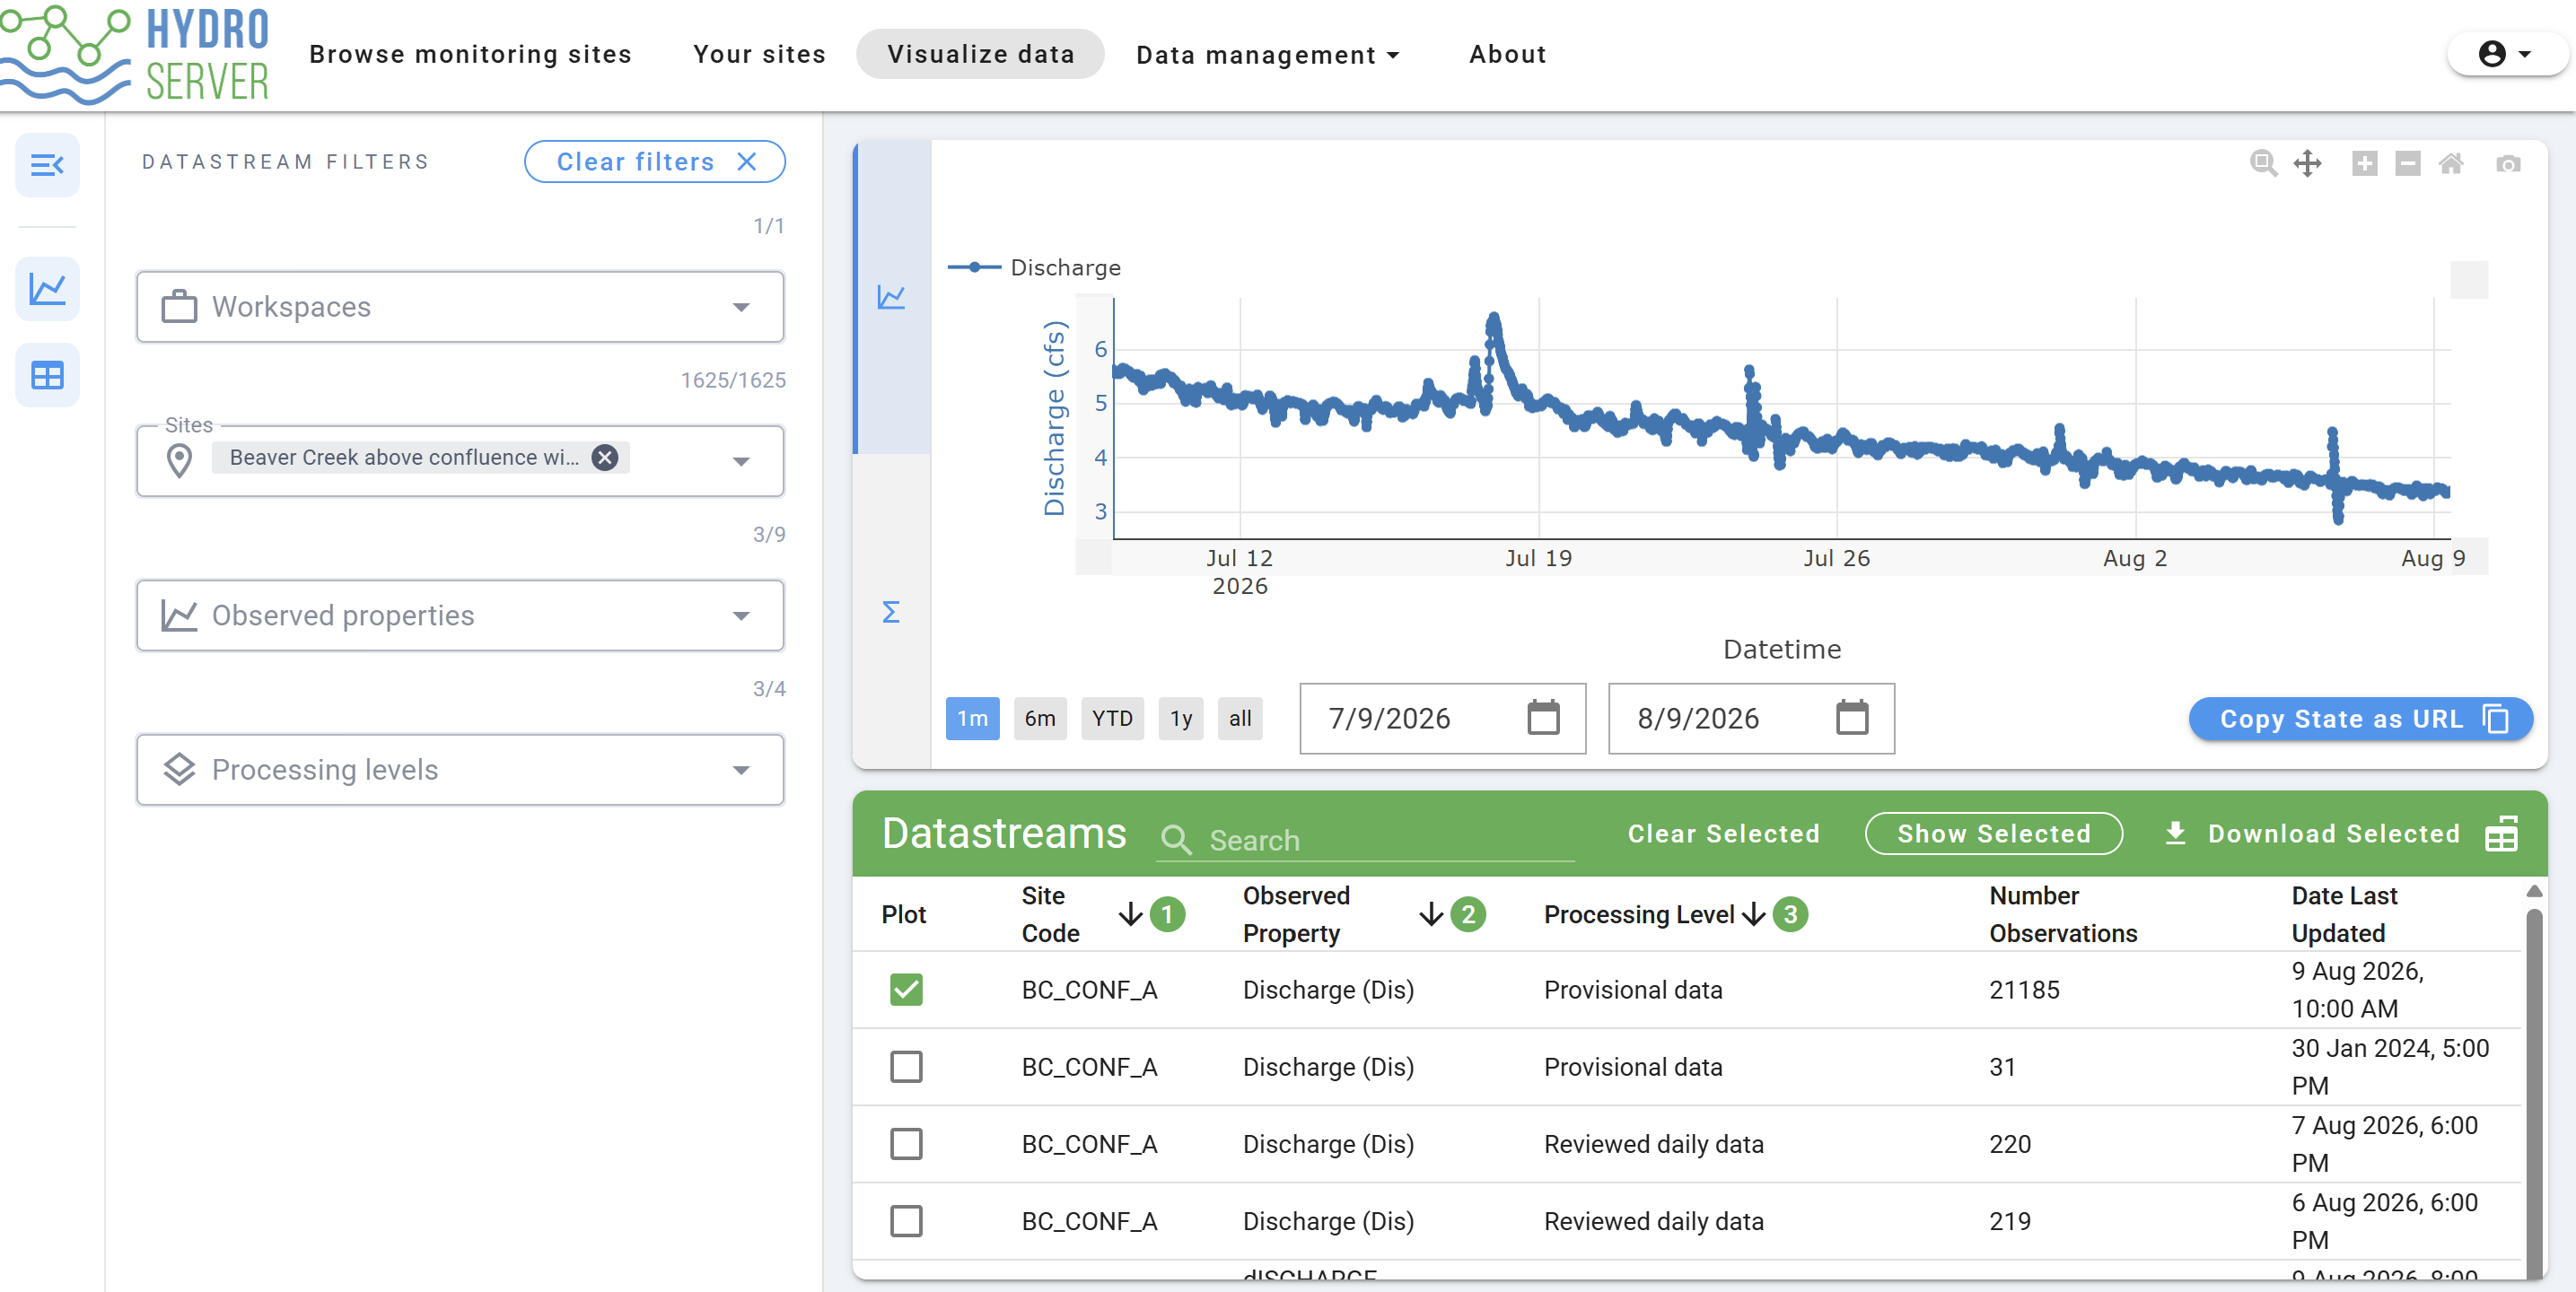
After the task name, schedule, input datastream, output datastream, rating curve CSV file, rating curve name, description, and fitting method are complete, click Create rating curve task. Once the task runs successfully, go to the output datastream on the monitoring site details page and open Visualize data to view the calculated rating curve output. The plot shows the discharge values calculated from the input water-level or gage-height data using the rating curve.